 |
|
|||

|
The
Prevalence of Computer Viruses
[Comparisons] [Numbers] [Trends] [Sources] Comparisons To
Biological Disease Spread [Top] The problem with a strict biological comparison is that, in some ways, the computer world is more variable than the human body. For example, the various ways in which people thwart computer virus epidemics raises some interesting issues. As Kephardt and White note, "After discovering a viral infection, users may initially become much more conscientious about using anti-virus software, but if a long time passes without incident they may relax their vigilance to some degree. Models analogous to this scenario have been studied within a biological context, for there are some cases in which the body gradually loses its immunity to a particular disease [2]. Another interesting notion is the ``kill signal'', a message sent by a node upon discovering that it is infected, warning all nodes to which it is connected that they may also be infected. Our preliminary investigations suggest that this may be one of the most powerful means for thwarting epidemics."[3] The idea of the kill signal is not new, for cell signaling in the human immune system is one of the most effective methods for halting the further infection of a pathogen. Kephardt and White hope that we will be able to adapt other biological protection mechanisms to the computer world, but for now, virus detection and cleaning remains a rather discrete process. See How Anti-Virus Software Works See also: Since the Internet has grown exponentially over the past decade, it is reasonable to assume that viruses have followed a similar pattern. However, prior to 1995, the actual statistics on virus prevalence did not agree entirely with this pattern. A study from 1995[4] demonstrated the growth curve of viruses since 1988. Not only had the overall number of viruses increased (Fig 1), but the rate of infections had increased as well (Fig 2). According to the study, this rate of increase followed a linear pattern, quadratic at worst, but was nowhere near exponential. Another interesting statistic is that, in 1995, two-thirds of all virus incidents were caused by the top ten viruses (Fig 3).  Figure 1: Cumulative number of viruses for which signatures have been obtained by IBM's High Integrity Computing Laboratory vs. time. There are thousands of viruses, but only a few have been seen in real incidents.[5]  Figure 2:The number of new viruses appearing worldwide per day has been increasing steadily.[6]  Figure 3: The top ten viruses account for two thirds of all incidents. All of them are boot-sector infectors.[7] In 1996, ICSA Labs, a division of TruSecure Corporation, began publishing an annual report called "The ICSA Computer Virus Prevalence Survey." The most recent survey contains data for the past five years and shows that viruses are still on the rise.Table 1 details the monthly rate of infection per thousand PCs for the first two months of each year from 1996 through 2000. Notice the enormous jump in infections from 1998 to 1999. This represents the dramatic increase in the number of mass-mailers that occurred in 1999. Recall that this was the year of Happy99 and Melissa, two email-based viruses that sparked an explosion of copy-cat mass-mailers.
Table 1: Monthly rate
of infection per 1000 PCs for first two months of years 1996-2000.[8] Trends in Prevalent
Types of Viruses [Top]  Figure 4: Boot viruses have continued to rise in prevalence, while file viruses have declined.[10] Interestingly enough, the White, Kephardt, and Chess paper that noted the overwhelming proportion of boot viruses also attempted to predict the future of viruses. They rightly determined that two major factors would contribute to vast changes in the virus landscape over the following years: 32-bit operating systems such as Windows 95, and the increasing amount of networking around the globe. Up until then, almost all viruses were still transferred through traditional "hard" media such as floppy disks and hard drives, but the authors correctly foresaw that the growing number of people connected to the Internet would cause this medium to become the new battle zone for the present day virus wars.[11] ICSA's 2000 Computer Virus Prevalence Survey details the immense swing from old-era file and boot viruses to the new-age Internet-enabled viruses that began showing up in the mid-90's. In the year 2000, boot viruses and file viruses are practically off the map, supplanted by the more recent mass-mailers and macro viruses. The chart below shows the most prevalent viruses of the last two years: 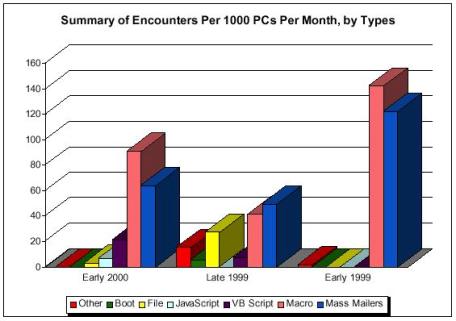 [12] [12]
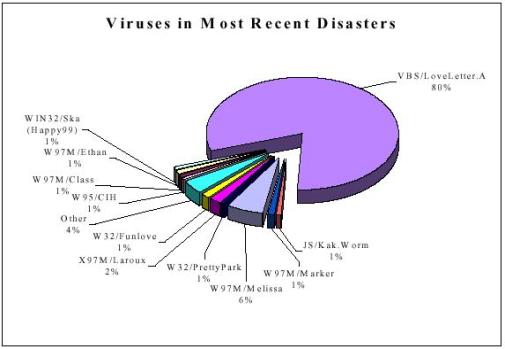
As you can see, JavaScript and VBScript entered the charts, while macro viruses and mass mailers dominated the scene. The chart is somewhat misleading in that it only shows the discrete number of incidents per each type of virus but does not convey the size of the incident. The following chart addresses this question and shows that the LoveLetter virus caused nearly 80% of the incidents in the year 2000, making it the most damaging virus attack of all time.
1. Kephardt, Jeffrey and Steve White. "Directed-Graph Epidemiological Models of Computer Viruses." Copyright 1994 Institute of Electrical and Electronics Engineers. Reprinted from Proceedings of the 1991 IEEE Computer Society Symposium on Research in Security and Privacy; Oakland, California, May 20-22, 1991; pp. 343-359. Accessed online at http://www.research.ibm.com/antivirus/SciPapers/Kephart/VIRIEEE/virieee.gopher.html. 2. http://www.research.ibm.com/antivirus/SciPapers/Kephart/VIRIEEE/virieee.gopher-node19.html#Bailey 3. "Directed-Graph Epidemiological Models of Computer Viruses." 4. Computer Viruses: A Global Perspective by Steve White, Jeffrey Kephart and David Chess 5. Ibid. 6. Ibid. 7. Ibid. 8. The 2000 Computer Virus Prevalence Survey. http://www.trusecure.com/html/tspub/pdf/vps20001.pdf 9. Computer Viruses: A Global Perspective 10. Ibid. 11. Ibid. 12. 2000 Computer Virus Prevalence Survey, 17. 13. Ibid.
|
 [
[