Download
Evaluation Script
Evaluation Script
ver 1.1 / 784MB
Download
Baselines
Baselines
GitHub repo
Standard accuracy. For each question-answer pair (q,a), we give 1 point if the predicted answer p matches a and 0 otherwise, and average over all questions in the dataset.
We recommend using the new Test-Dev split to evaluate your performance during development in order to get a precise estimation of the expectable test results. (i.e. instead of using the older Validation split). We also provide both spatial as well as object-based visual features, to allow better comparability between different approaches. In particular, please note that using the VG object-based features may lead to "false" scores on the GQA validation set since they were trained on all of Visual Genome images which intersect with GQA Validation set. However, they should be completely safe to use when evaluating on Test-Dev, Test or Challenge splits.
In order to increase the reliability of accuracy as a measure of the true model's visual reasoning capacities, we have carefully balanced the dataset using the question's semantic representation. We have looked at the answer distribution for groups of questions about similar concepts, and applied an iterative smoothing technique that spreads the "excess" distribution from common answers to less frequent ones, turning the answer distribution into a more uniform one, while retaining the original real-world tendencies (but somewhat smoothed out). Below we present an example of the smoothing we have performed. Note that we thus compute accuracy only over the balanced test dataset, regardless of the training set being used.
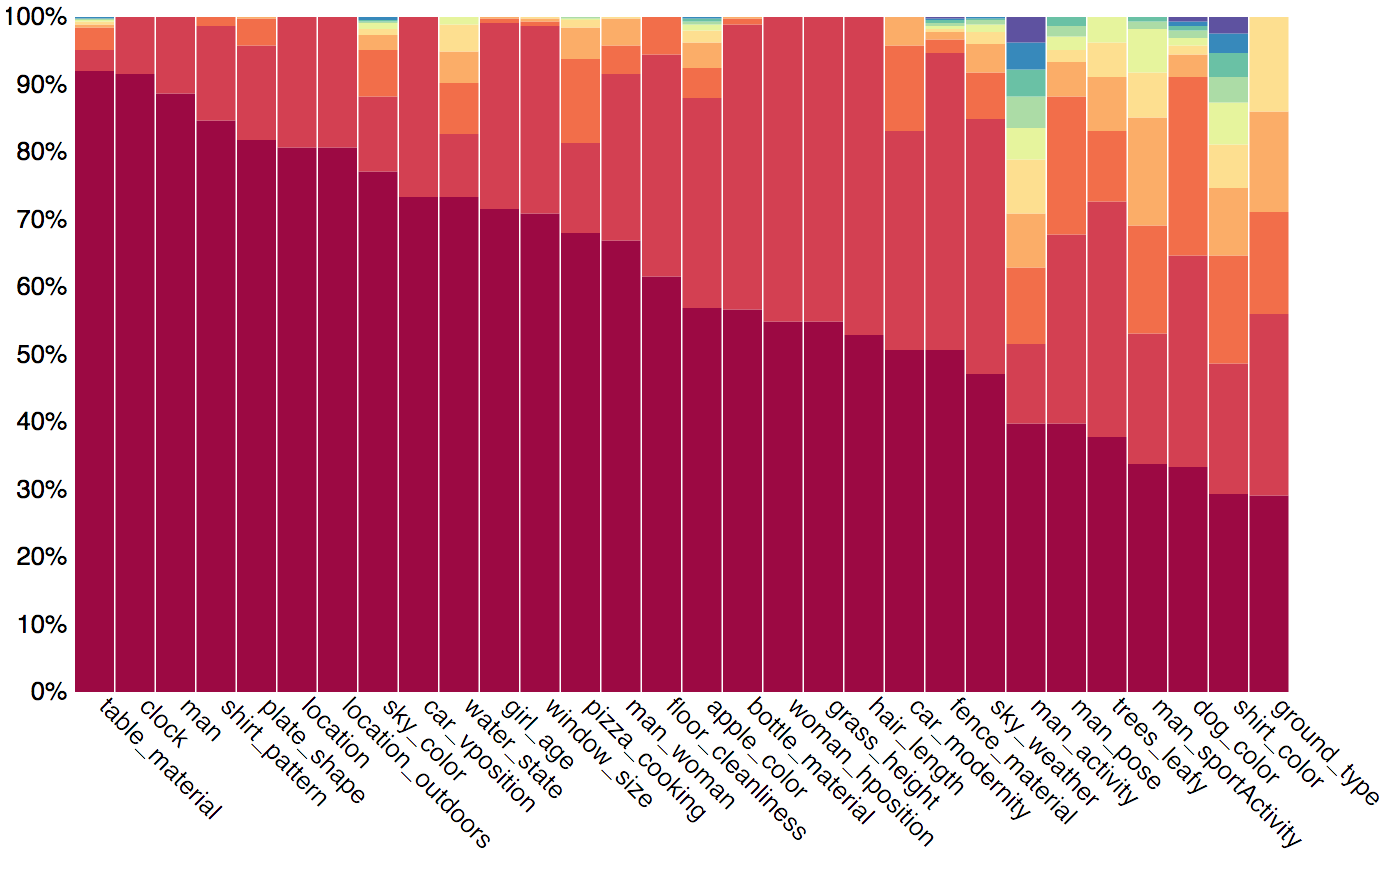
 See the paper for further details.
We recommend using the new Test-Dev split to evaluate your performance during development in order to get a precise estimation of the expectable test results. (i.e. instead of using the older Validation split). We also provide both spatial as well as object-based visual features, to allow better comparability between different approaches. In particular, please note that using the VG object-based features may lead to "false" scores on the GQA validation set since they were trained on all of Visual Genome images which intersect with GQA Validation set. However, they should be completely safe to use when evaluating on Test-Dev, Test or Challenge splits.
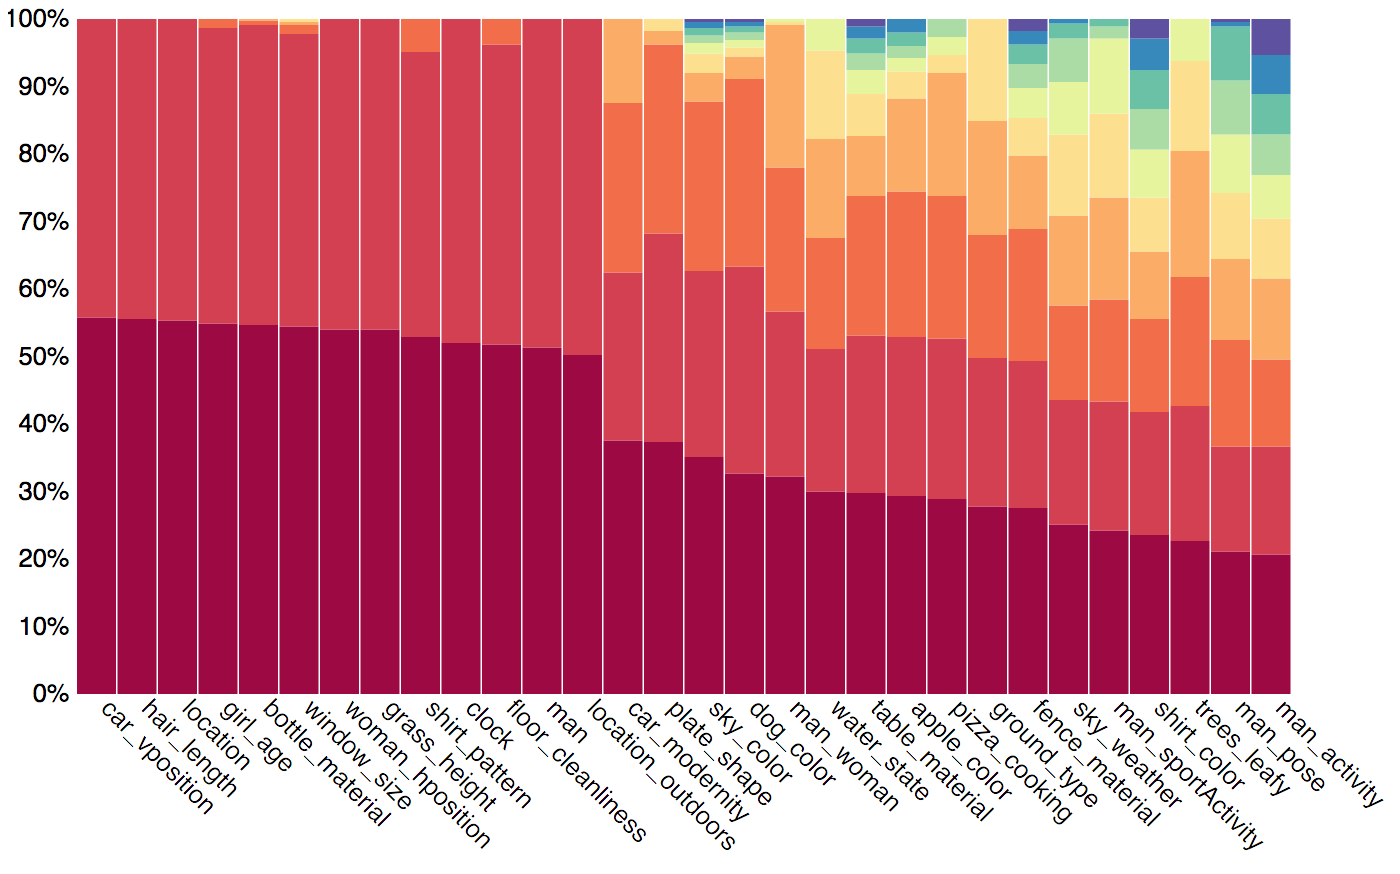
In order to increase the reliability of accuracy as a measure of the true model's visual reasoning capacities, we have carefully balanced the dataset using the question's semantic representation. We have looked at the answer distribution for groups of questions about similar concepts, and applied an iterative smoothing technique that spreads the "excess" distribution from common answers to less frequent ones, turning the answer distribution into a more uniform one, while retaining the original real-world tendencies (but somewhat smoothed out). Below we present an example of the smoothing we have performed. Note that we thus compute accuracy only over the balanced test dataset, regardless of the training set being used.
A metric for the level of consistency in responses across different questions. For each question-answer pair (q,a), we define a set Eq={q1, q2, ..., qn} of entailed questions, the answers to which can be unambiguously inferred given (q,a). For instance, given the question-answer pair Is there a red apple to the left of the white plate?, we can infer the answers to questions such as Is the plate to the right of the apple?, Is there a red fruit to the left of the plate?, What is the white thing to the right of the apple?, etc.
Denote Q the set of all questions the model answered correctly. For each question q in Q, we measure the model's accuracy over the entailed questions Eq to get the score sq and finally average these results across all questions in Q.
This metric allows us to evaluate the model consistency across questions – whether or not it gives contradictory answers to equivalent and entailed questions.
Measures whether the model gives valid answers, ones that can be theoretically correct for the question. For each question q we define an answers scope V, with all answers possibly correct for some image. For instance, only colors for color-questions, only animals for question that starts with 'What animal...' or yes/no for binary questions. We then give 1 point if the model's prediction p is in V and 0 otherwise. We then measure these scores over all questions in the dataset.
Measures whether the model responses are reasonable in the real world or not making sense. For each open question q about an attribute a of an object o we check whether the model's prediction p occurs at least once with the object o over the whole dataset scene graphs. We give 1 point if it occurs and 0 otherwise. For instance, for a question about the color of an apple, we will regard colors such as green and red as plausible since they occur as attributes of some apple in the whole dataset, and blue or purple as implausible, since they don't.
Similarly, for each open question q about a relation (s, r, t), we check whether the model prediction p occurs at least once in relation with the object s, .i.e. check if (s, r, p) occurs in the dataset.
While this metric may be less precise for infrequent objects, especially when measuring generalization to new unseen environment, it may give a good sense of the general level of world-knowledge the model has acquired.
For attention models only. Measures whether the model attends to regions in the image that are relevant for the question. For each question-image pair (q,i), we define a pointer r to the region in the image which the question refers to and is relevant to answer it (or alternatively, multiple pointers to relevant regions). We then look at the model visual attention over the image i when answering the question, and sum up the overall attention over r. This is the grounding score for that question, which we then average over all questions in the dataset.
This metric allows us to evaluate the degree to which the model is truly grounding its reasoning in the image, rather than just making educated guesses based on language priors or world tendencies.
This metric allows us to evaluate the degree to which the model is truly grounding its reasoning in the image, rather than just making educated guesses based on language priors or world tendencies.
Measures the overall match between the true answer distribution and the model predicted distribution. We partition the questions in the dataset into groups based on their subject, e.g. (apple,color) for all color questions about apples, etc. For each group G, we look at the true answer distribution across the dataset and the distribution of the model's predictions over the same questions. We then compare these distributions using Chi-Square statistic, and average the scores across all groups.
This metric gives us a good sense of the general level of world-knowledge the model has acquired, and especially allows us to see if the model predicts not only the most common answers but also the less frequent ones.
This metric gives us a good sense of the general level of world-knowledge the model has acquired, and especially allows us to see if the model predicts not only the most common answers but also the less frequent ones.